Suppose you have a requirement to create a custom dashboard to publish CPU utilization of some set of VMs responsible to serve the application. In my case, I have picked a web application servers.


web-01a -> app-01a -> base-w10

Below are the steps to create a custom dashboard.
1. Create a Custom Group of VMs
2. Create a Views
3. Create a dashboard with the help of custom groups & views.
1. How to create custom group of vms.
Login to vrops and Click on Environment tab.


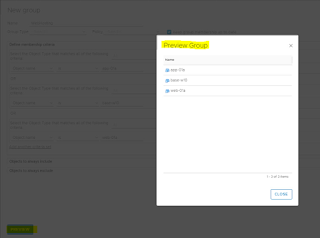
Please wait for sometime so that Health, Risk & Efficiency information will be captured. Below is the screenshot once information captured of custom group named "Webhosting"

Now custom group has been created and information is also captured, next step is to create CPU utilization views for virtual machines.
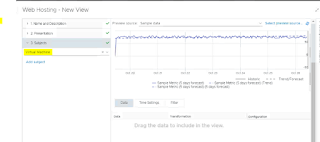
2. How to create Views in vRealize Operations Manager
Login to vrops and Click on Dashboard, Left side, there is option called Views.


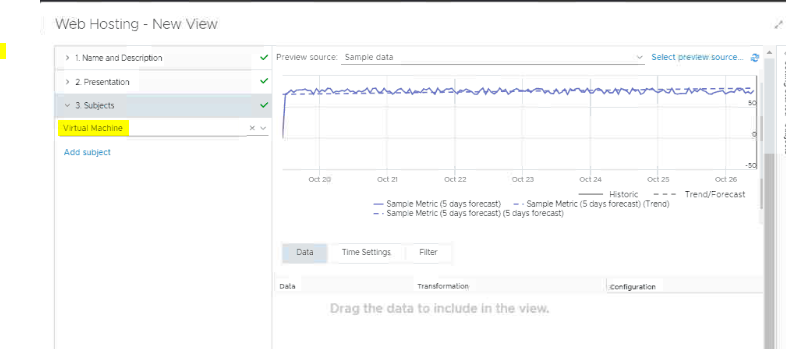


We have completed view creation and it can be seen in Views option of vROPS. Next step is to create dashboad using custom group & views.
3. How to create dashboard.


Here our dashboard creation completed and we can see the CPU utilization of all three responsible servers for web application hosting. Same way we can create a view for Memory utilization and following dashboard, we can integrate view with dashboard.
Please feel free to correct in case of incorrect information shared. I have used VMWARE HOL LAB to capture the screenshots. Using HOL LAB since long time and can say, these labs are fabolus, well explanation of VMware products. 😃😃😃😃😃😃